Background
Flux's API connects a retailer's POS to the bank network:
- Banks use the API to enrich their transactions with item-level data
- Retailers use the API to reconcile transactions to payment cards
Blueberry was the insights platform we built for retailers, which I helped setting up from scratch. We focused on unlocking insights on products and customers that normally would have required the retailer to ask for an additional piece of information to be given away at the till — such as loyalty cards, email addresses, QR codes to scan or other unique identifiers.
Responsibilities
The project was started when Flux was a year old. Our product team consisted of two developers (one front-end, one back-end), one data scientist and myself.
I was responsible of:
- Run research and testing sessions with our current and prospective partners
- Organise the roadmap, spec out and plan new functionalities
- The app UI, the interactions and the information architecture of it
- Develop data viz patterns, closely with data science
Research
We run multiple sessions of exploratory research to validate our assumptions.
Flux's retail users were primarily in the marketing department of SMEs operating in the food space (low value / high volume). We identified these problems affecting them:
- Poor understanding of customers' behaviour. Their sales were primarily in-store: without an extra identifier, they had no way to reconcile a sale to a customer.
- No resources for data analysis. They struggled measuring the success of their campaigns, and had no access to internal resources for data analysis. That often meant insights lagging by weeks, if at all available.
We set out to build an analytics platform that would help marketers make sense of the sales data, spot changes in normal sales patterns and, if they wanted, to intervene on them. The latter was done via one of Flux's core B2C products, offers and loyalty cards via banks. Retailers were able to use Blueberry to monitor the performance of the offers they were running on our platform, and to launch new ones.
The process
We operated similarly to Basecamp's Shape Up process, iterated quickly and with independence. Within six months we had a functional first version of the product launched and in use by our partner merchants, some of them operating more than 50+ stores nationwide.
- I run research sessions with our partners, spoke with employees in different functions of the business to understand each unique need and use for sales and customers data.
- I set up the user research practice at the company. I chose to adopt Notion as our research repository, and made heavy use of tables to tag observations, validate assumptions and build rainbow charts.
- I reviewed the competitors landscape. I took inspiration from direct competitors (POS systems, BA products), targeting platforms and data heavy apps operating in different sectors.
- I worked closely with front end to define the UI and data interaction patterns. We would join sales meetings showing prototypes with real data to verify that we were on the right track.
- I spent a lot of time figuring out the right way to visualise a metric. I took inspiration from Edward Tufte's work to define our visualisations. I also studied how completely different products — like Apple Health — visualise data for the end user. We wanted our insights to be accessible to everyone in the business, no matter their data literacy.
A document-first approach
From Shape Up we borrowed the idea pitches format — and heavily adopted Notion to shape an idea before making a bet on it.
This came particularly useful for managing incoming sales requests and turn them into useful insights, rather than taking them as requirements.
As an example, when we first launched clients kept asking us for a date picker. They wanted the ability to pick a start and end date. We noted the request, but decided to dig further: although implementing a date picker isn't hard, having users selecting random time periods would have caused technical and usability issues. For a start, it would have meant having to generate insights on the fly against any time comparison, which would have put strain on our backend.
After further research it became clear retailers operated in pre-defined time periods. We implemented a time picker that supported weeks, months and quarters and which satisfied our partners' needs.
Challenges
Some of the main challenges we encountered were:
- Resource constrain. Our team size forced us to focus on the essential. As an example of a compromise we made: in the early days we quickly realised real time was gonna be hard, but nearly real time (delayed by a minute) was gonna be far easier while providing the same benefits. The retailers we were working with were used waiting for days to access the data we were providing.
- Make our insights accessible to everyone in the business. Our main users were in the marketing team, not necessarily data experts.
- Balancing the retailers' desires with our privacy principles. We never gave away data on a specific user, but found a way to provide meaningful insights in the aggregate. Our focus was on customers segments and acquisition.
- Seasonality and black swan events. Sometimes our insights broke — if a day coincided with an holiday, the retailer's road was closed down for maintenance, or other events unknown to us.
Designs
We prioritised features according to desirability, feasibility and viability — we focused on building a platform that would provide insights on customers and products in near real time.
The app was organised in three main views reflecting our focus:
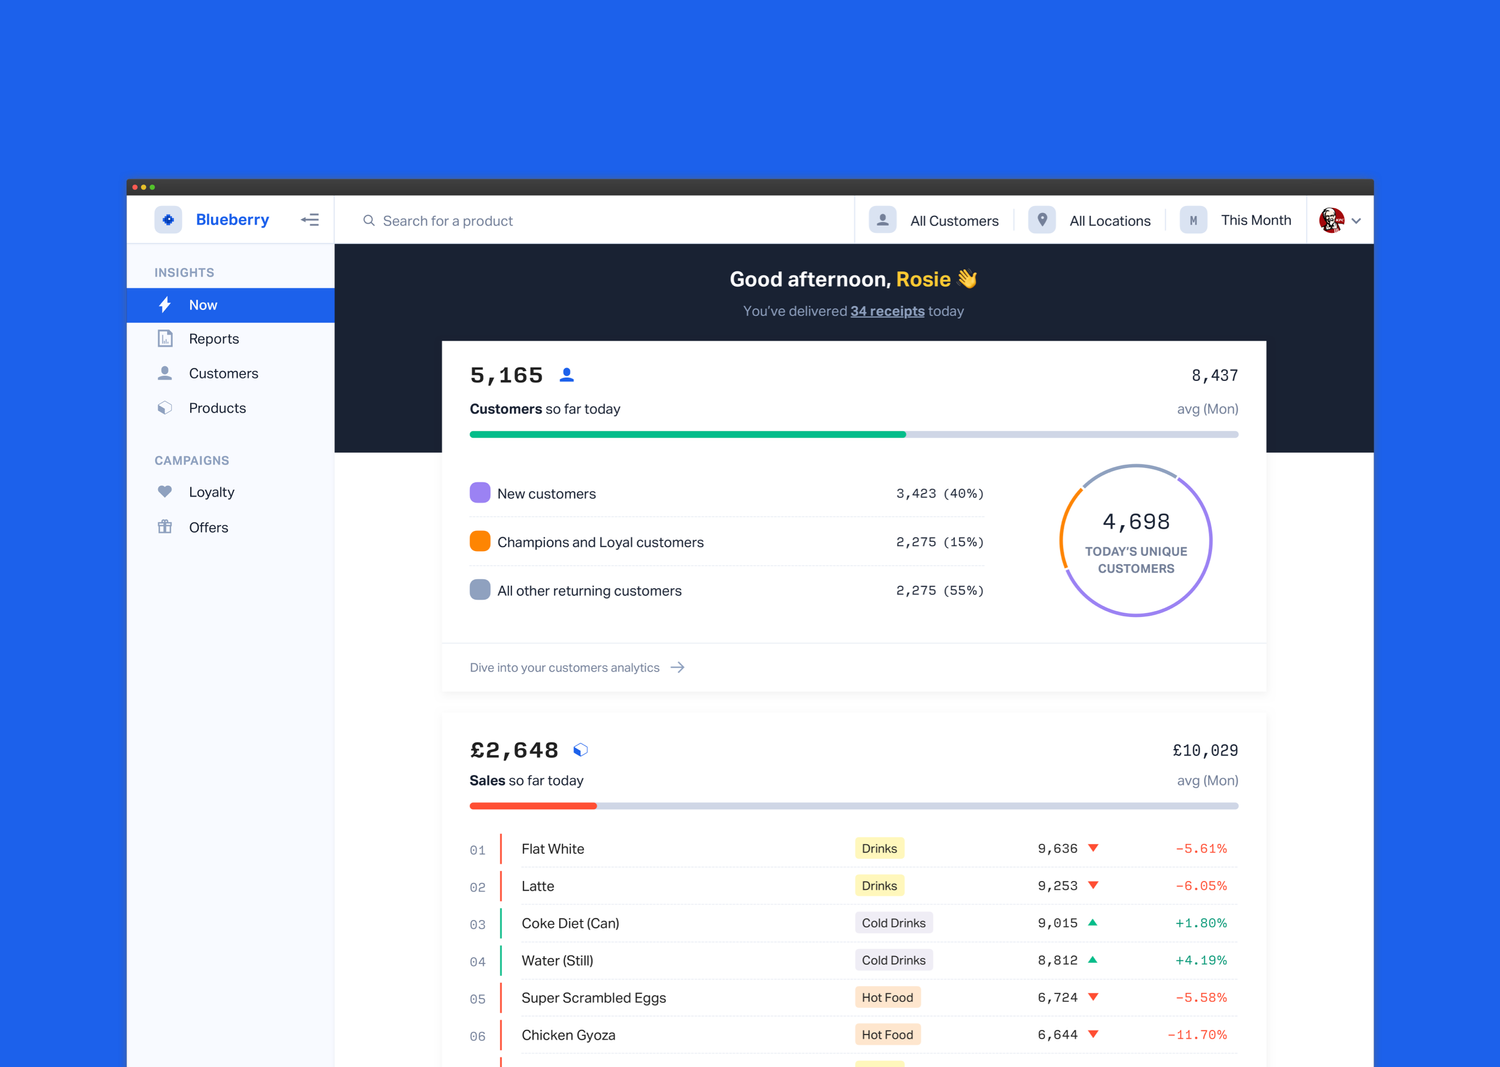
- A now view, acting as a retailer's status panel, giving the user a birds eye view of what was happening right now, today.
- A product view, to monitor sales and deep dive into the performance of specific products.
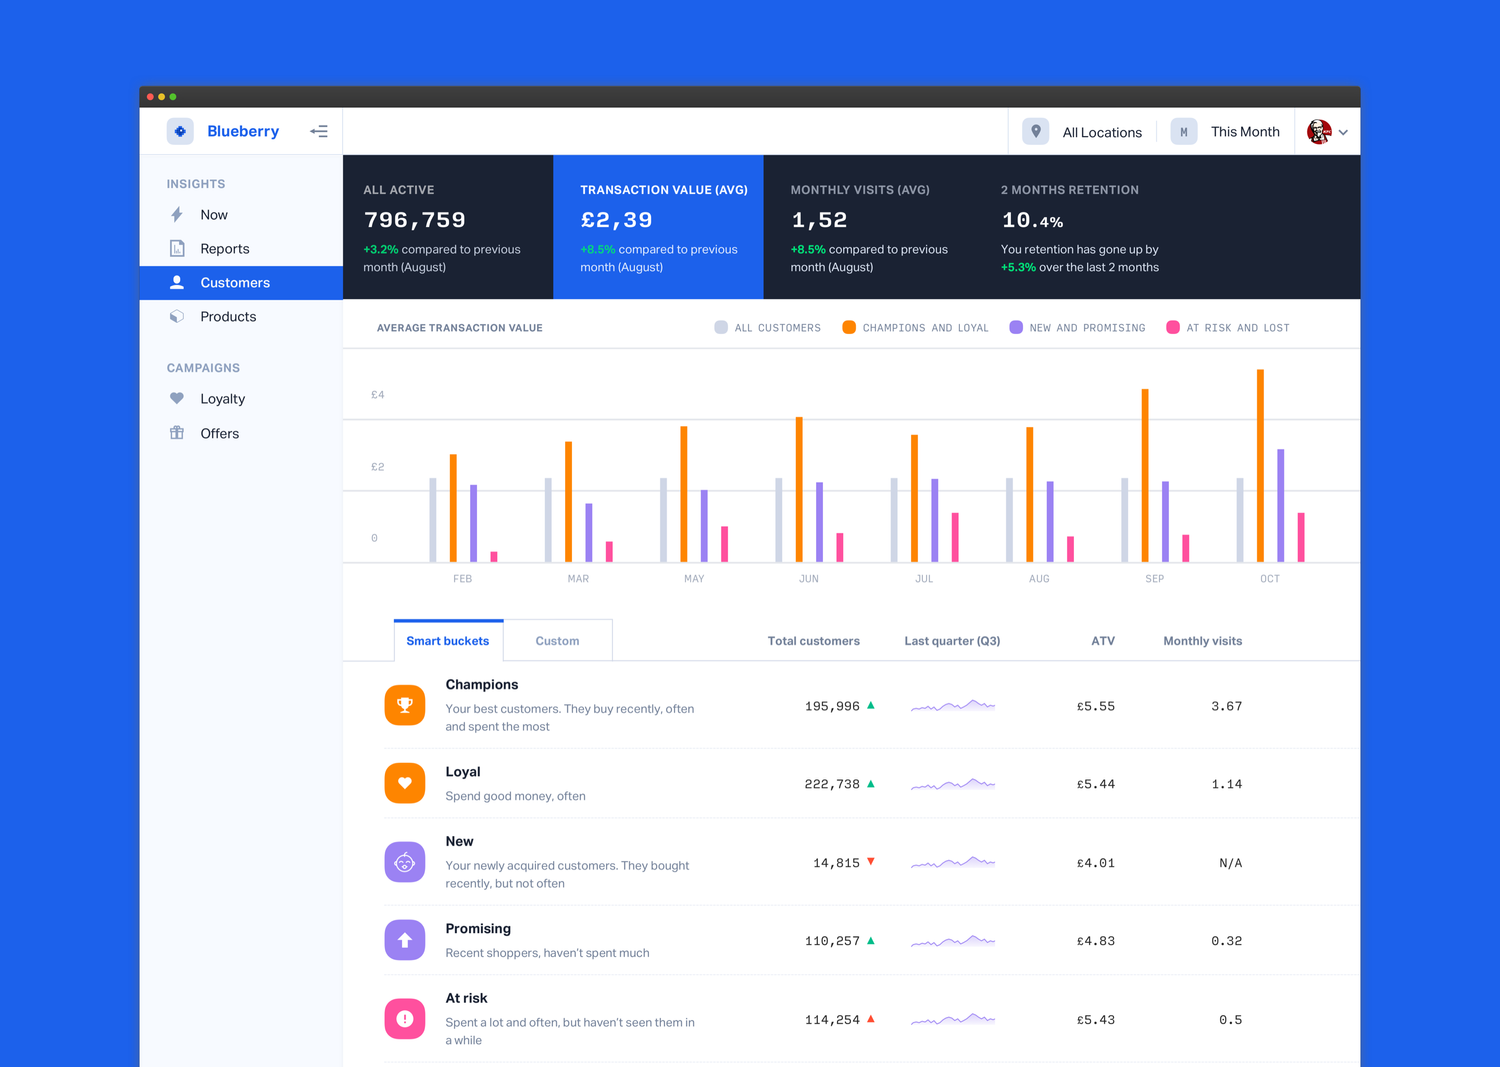
- A customer view, with auto segmentation and insights on customers behaviour.
A retailer's status panel
The now view functioned as the welcome screen of the app — a place to gauge, at a glance, how the day is going. We benchmarked a retailer performance against their average performance for that specific day of the week and let them know whether they were on track or underperforming.
Product insights
Food retailers have a lot of products, sometimes multiple variants of the same (we learnt that there are infinite declination of Coke). I decided to organise them in a table layout, highlighting the products trending positively or negatively to filter out the noise. A global set of filters, paired with search, allowed the retailer to quickly dive into the performance of a specific product or location.
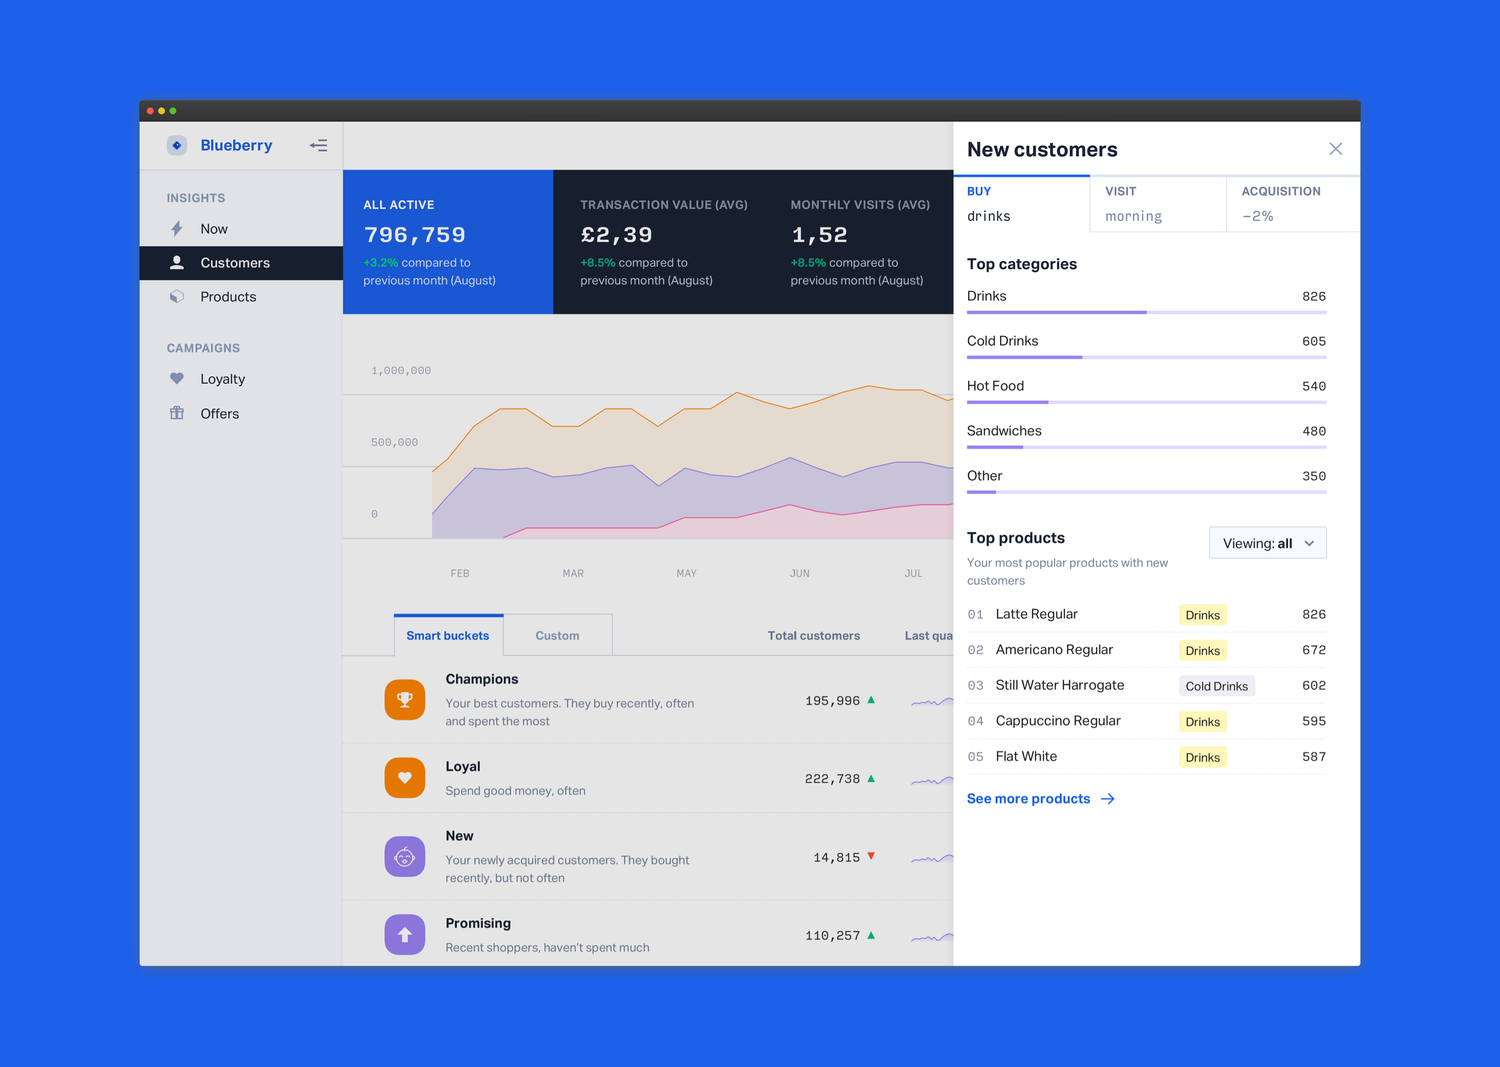
When clicking on a product a right side panel opened up, bringing up detailed metrics while keeping context. These included:
- Common product pairings
- Which type of customer is buying a product
- At what time or day of the week is a product popular
Interactions
Narrow into the details of each product. Clicking on any item opens up the right-side panel.
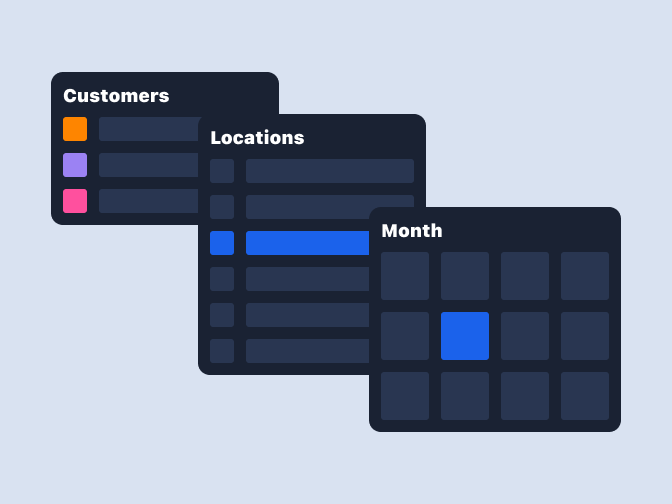
Filter products by store, customer type and time period.
Customers insights
The customers' data was our USP. Our focus was on auto segmentation of customers into buckets. For each segment we provided detailed information on its customers' behaviour, common product pairings and retention.
I spent a lot of time working with data science and sales to understand how retailers bucket their customers. We researched and tested the different segmentation models in the industry via weekly pdf reports, before choosing to adopt a common RFM model that made sense for the kind of verticals (high volume, low value) that we were serving.
Retailers used the customer view to answer questions such as:
- Are customers moving to upper tiers (from regular to loyal)?
- What are my loyal customers buying? Which products are good at acquiring new customers?
- Am I retaining my new customers?
Interactions
Switch between key metrics to see how they change over time.
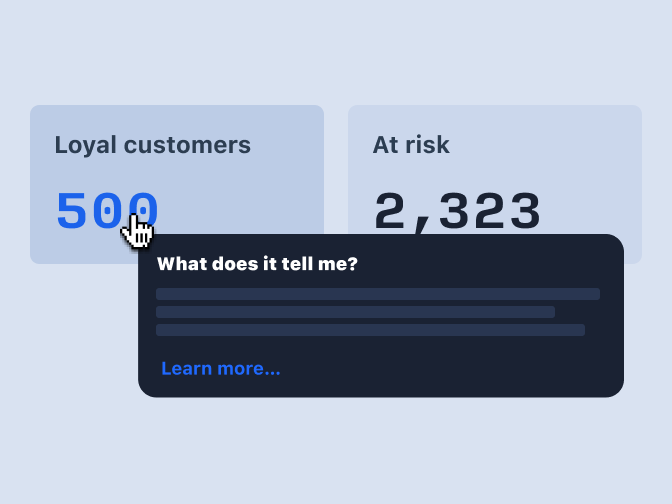
Hover on any figure to find out how it was calculated, and what it tells you.
Global filters
From the top bar, retailers could directly search for a specific item or see how the top products changed by season, location or type of customer.
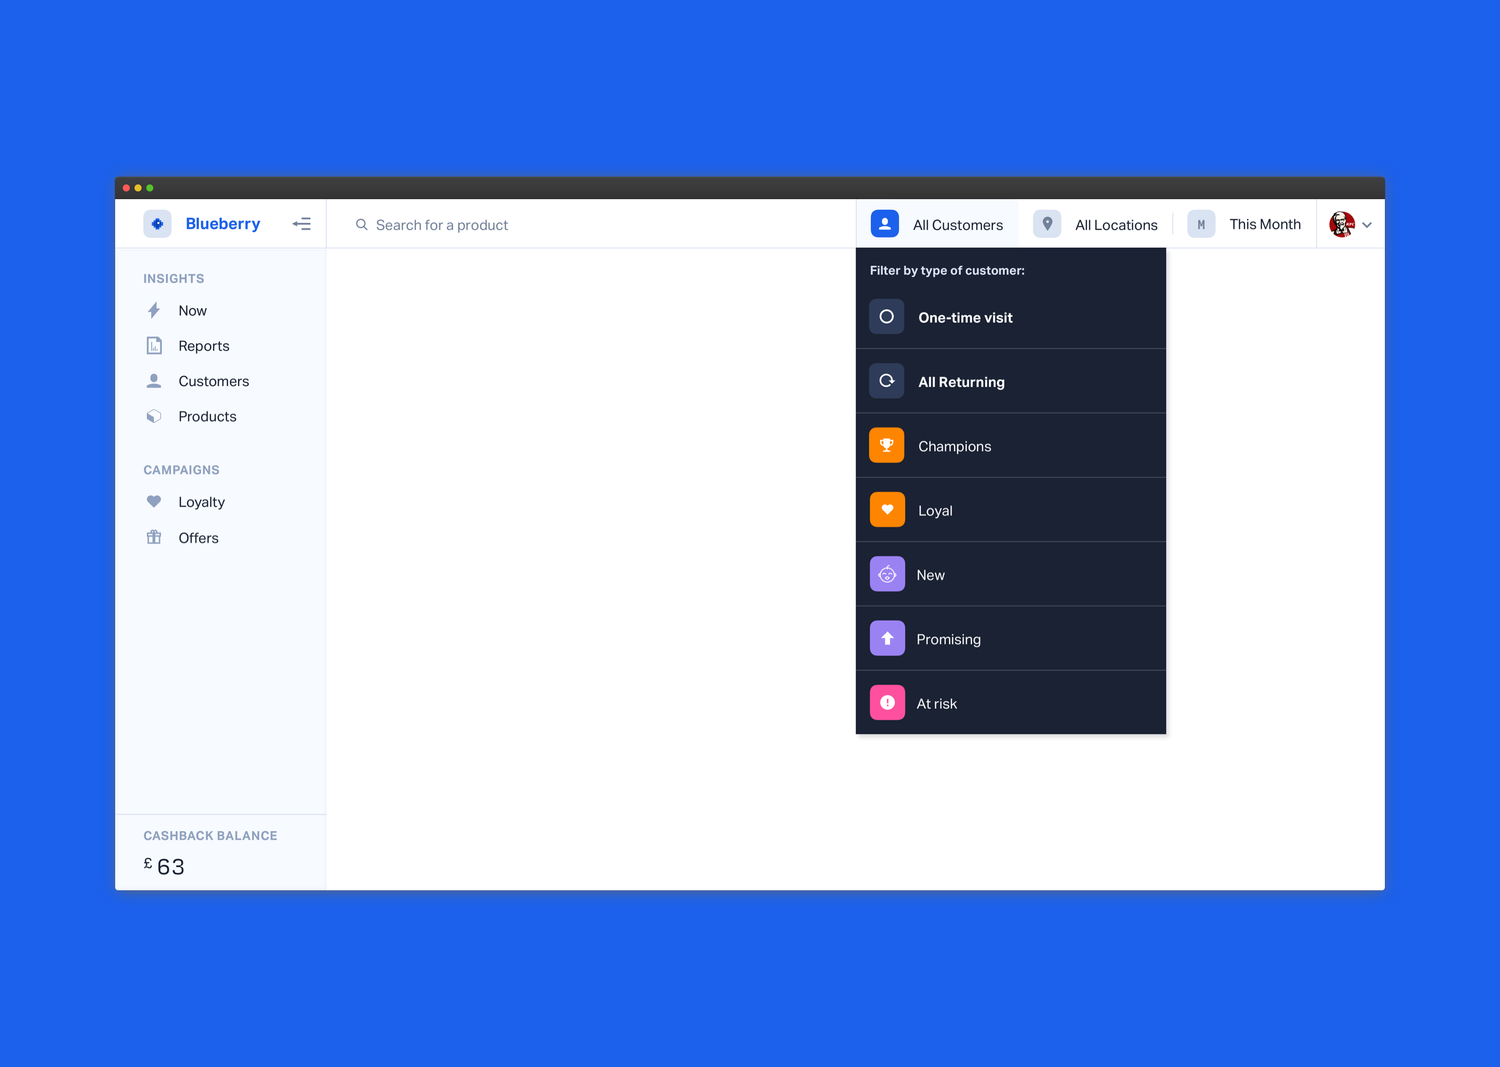
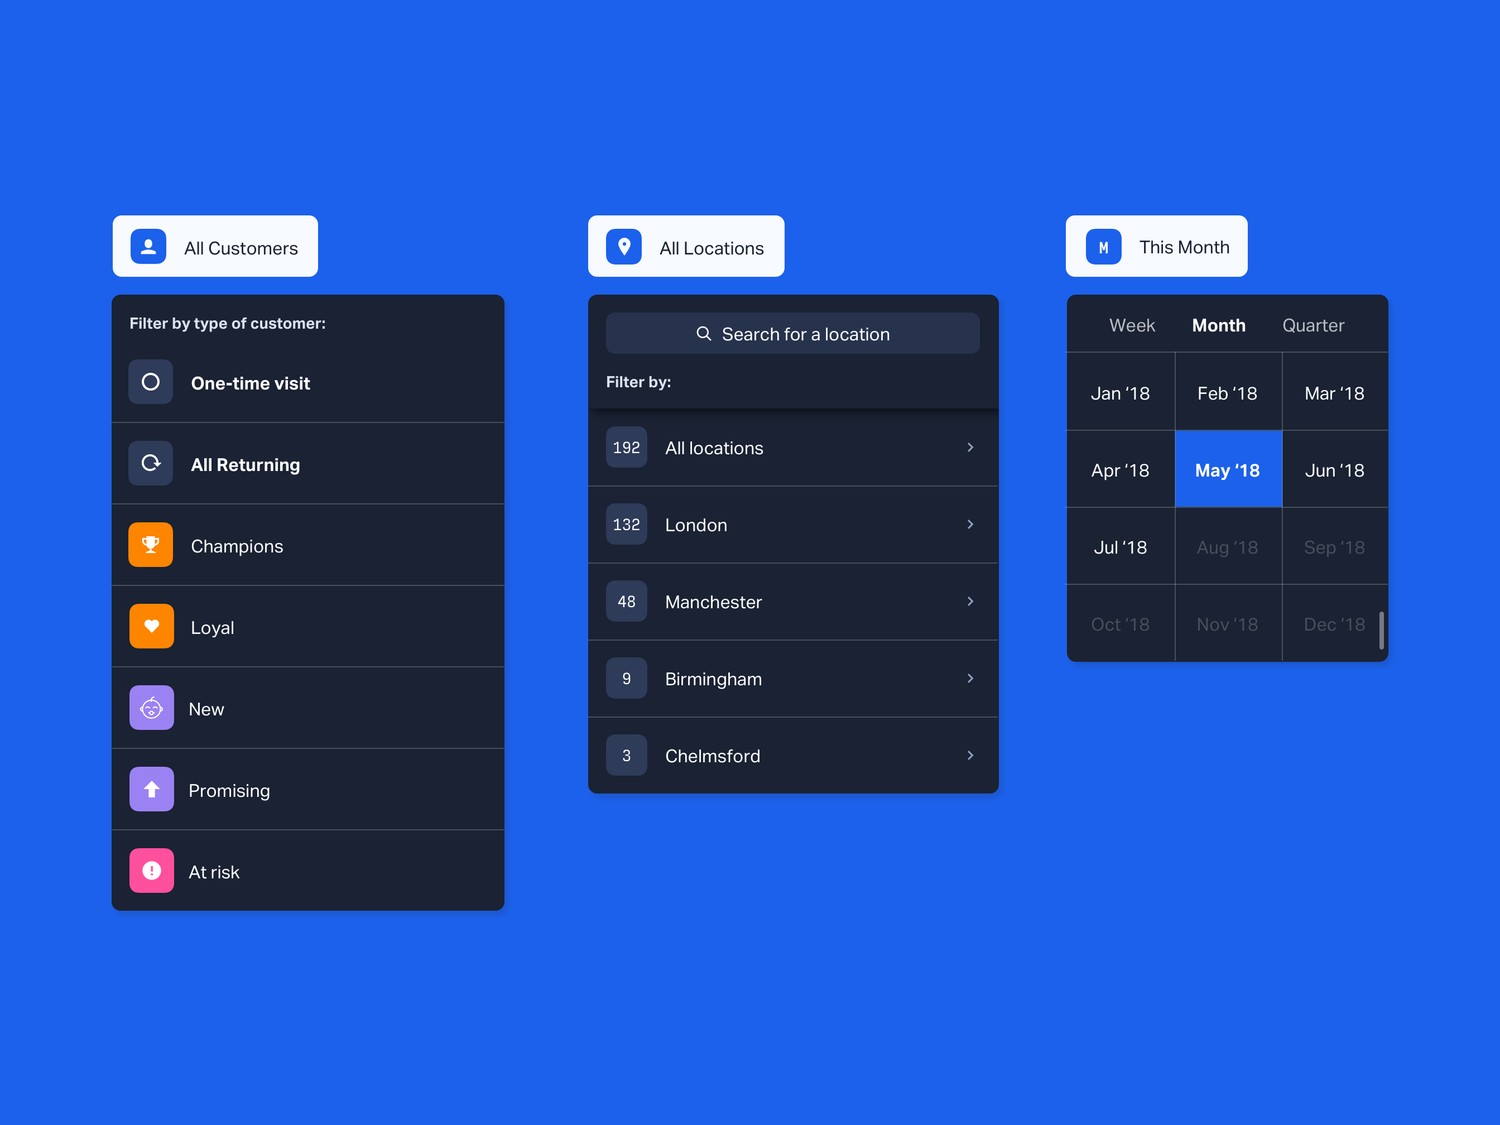

Filter by type of customer, location or period.
Weeks, months and quarters to choose from.
Targeting and monitoring
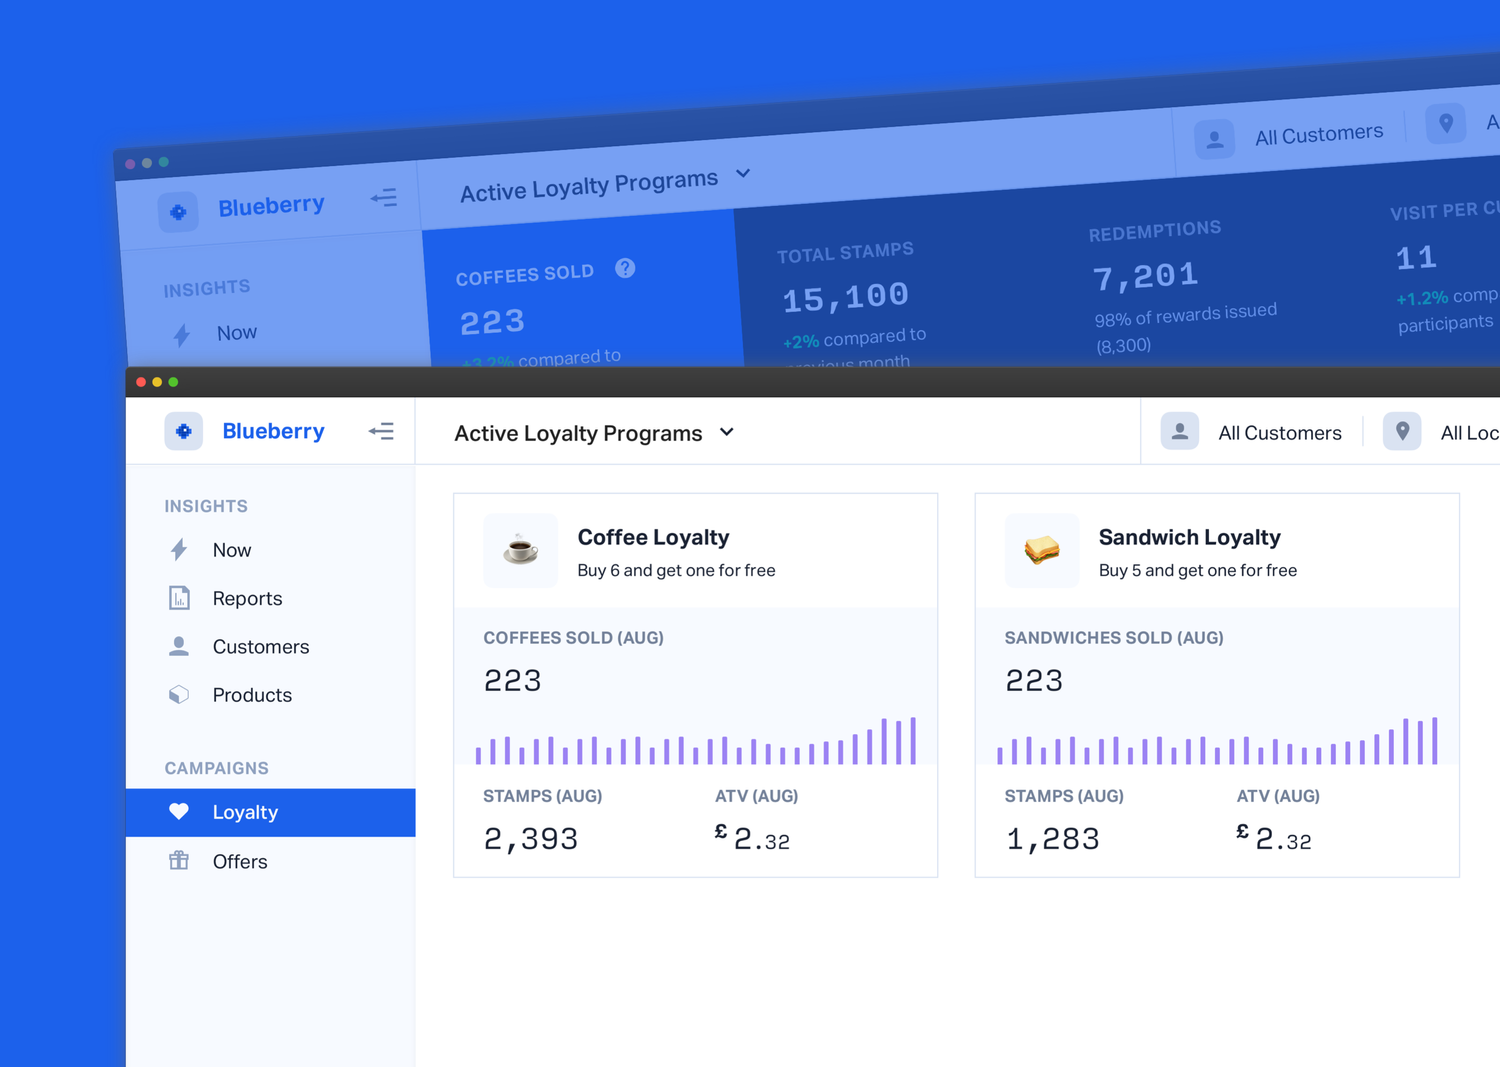
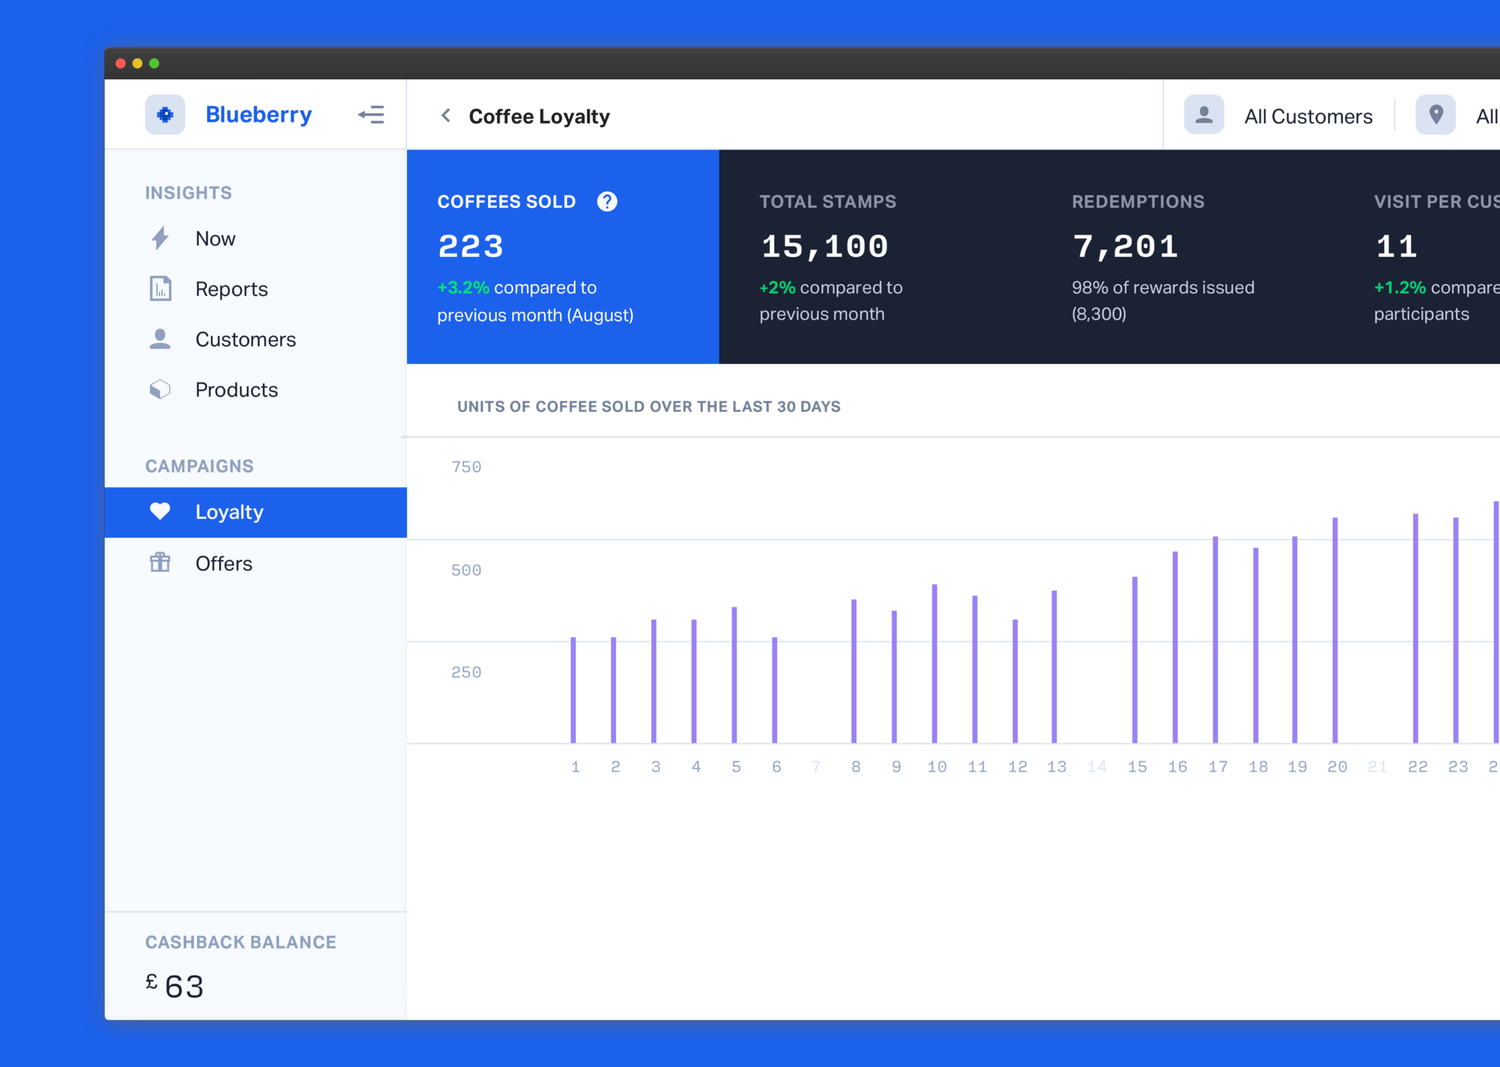
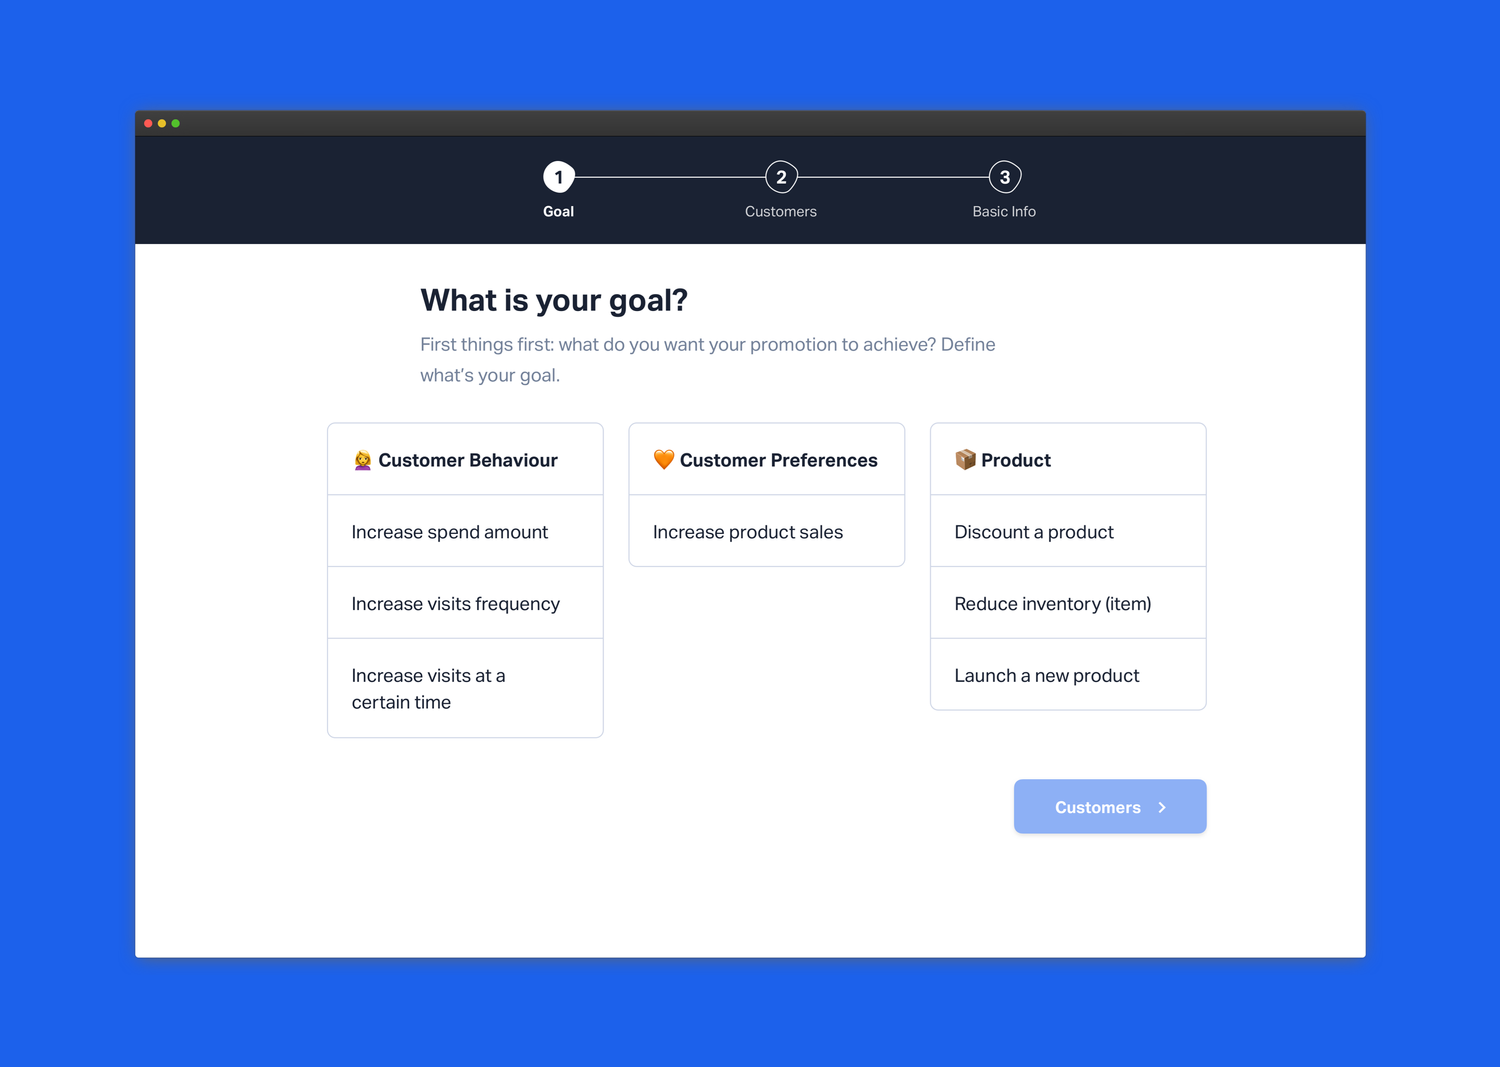
Most retailer partners chose to run offers and/or loyalty programs on our platform. Blueberry was where they could monitor the performance of their campaigns, and launch new ones.
Smart insights
Over time we got better at pushing insights to our users, when something happened. As previously detailed our aim wasn't to built yet another data exploration tool, or compete with tools like Looker. We wanted to do the heavy work of surfacing relevant insights for the retailer, when an event was detected — a sudden dip in sales for a specific store, a product overperforming, etc.
The visualisations below were all designed for a later version of Blueberry — hence the different colour scheme in use for data. However they give a sense of the kind of insights we wanted to provide to our customers.
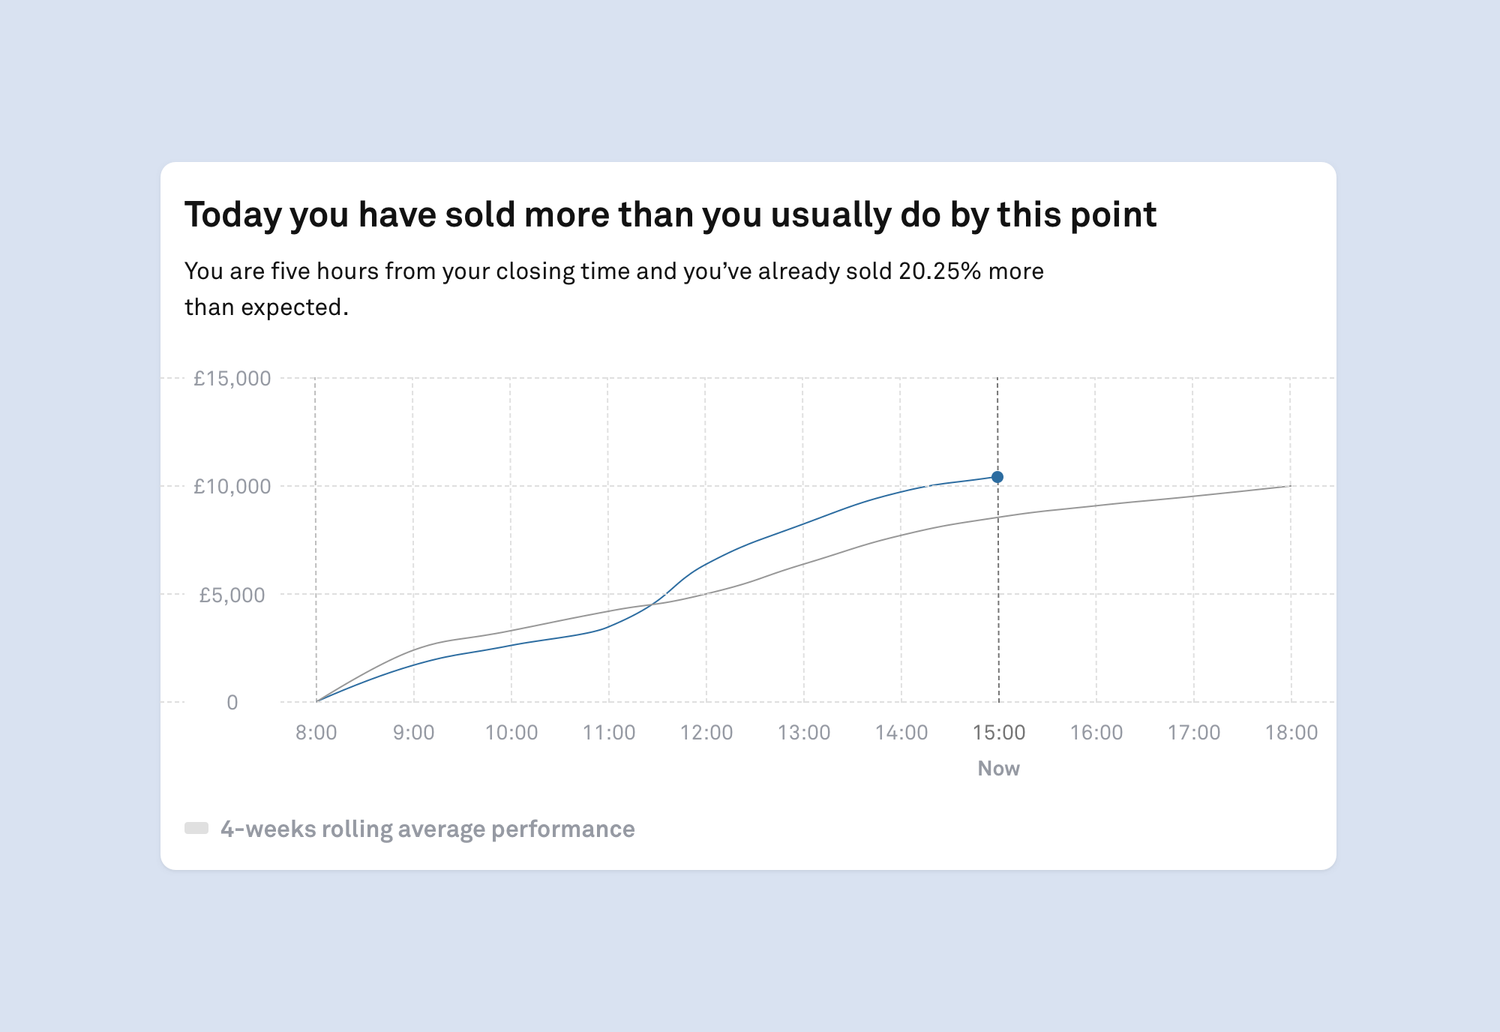
Get alerted of a spike or downturn of sales.
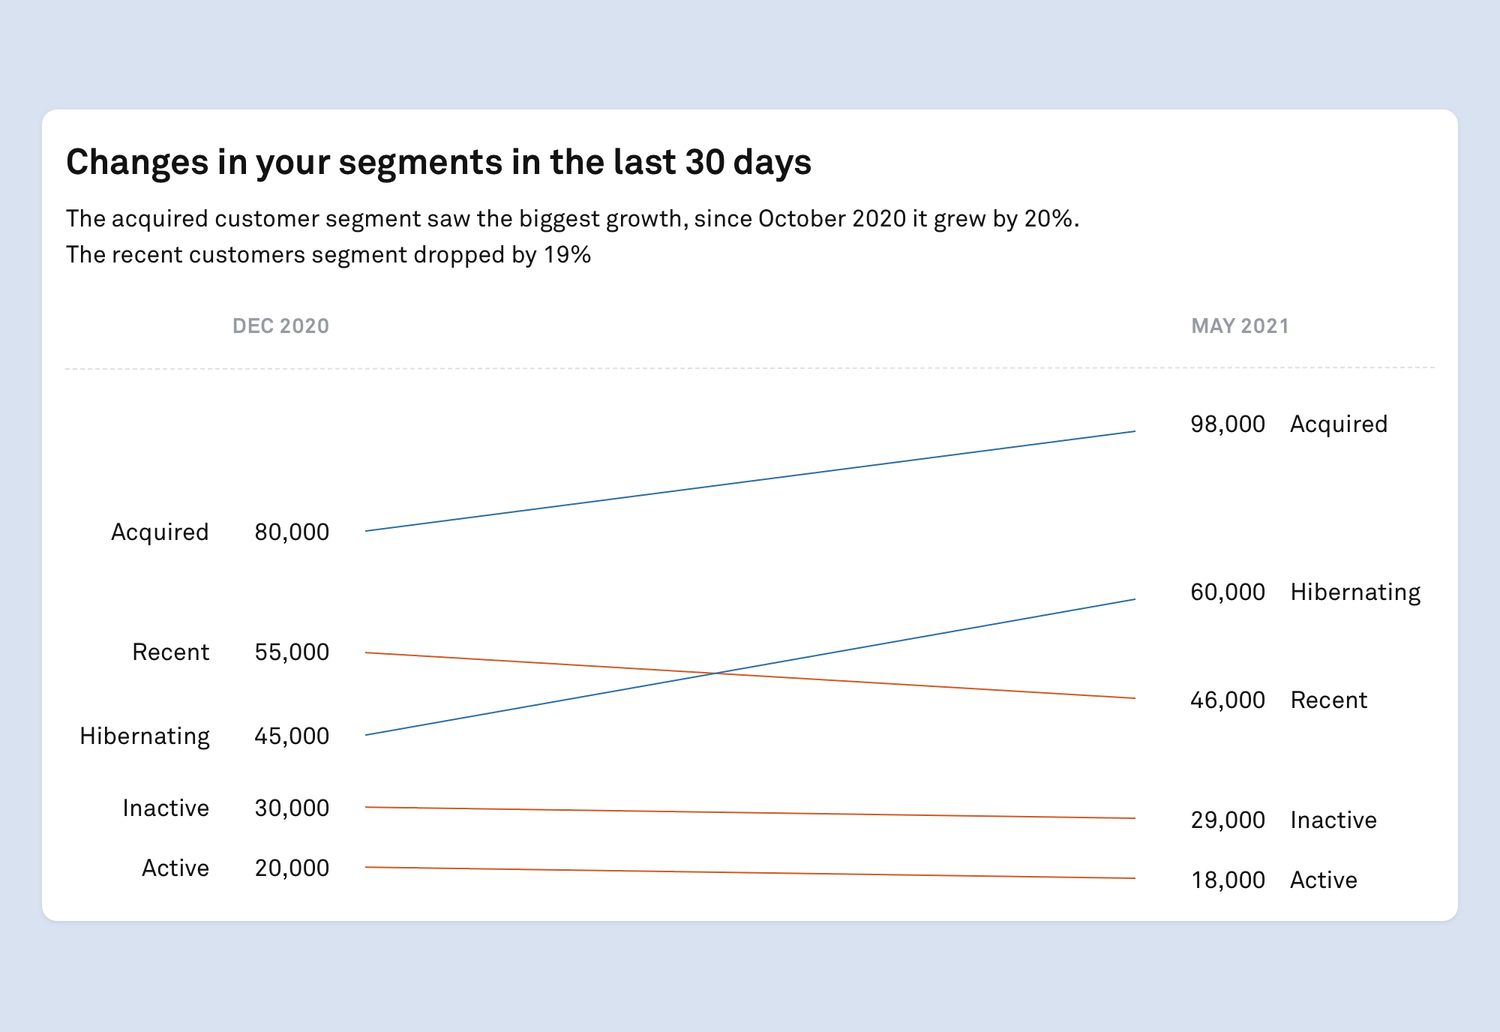
See which segments are growing and which are shrinking, at a glance.
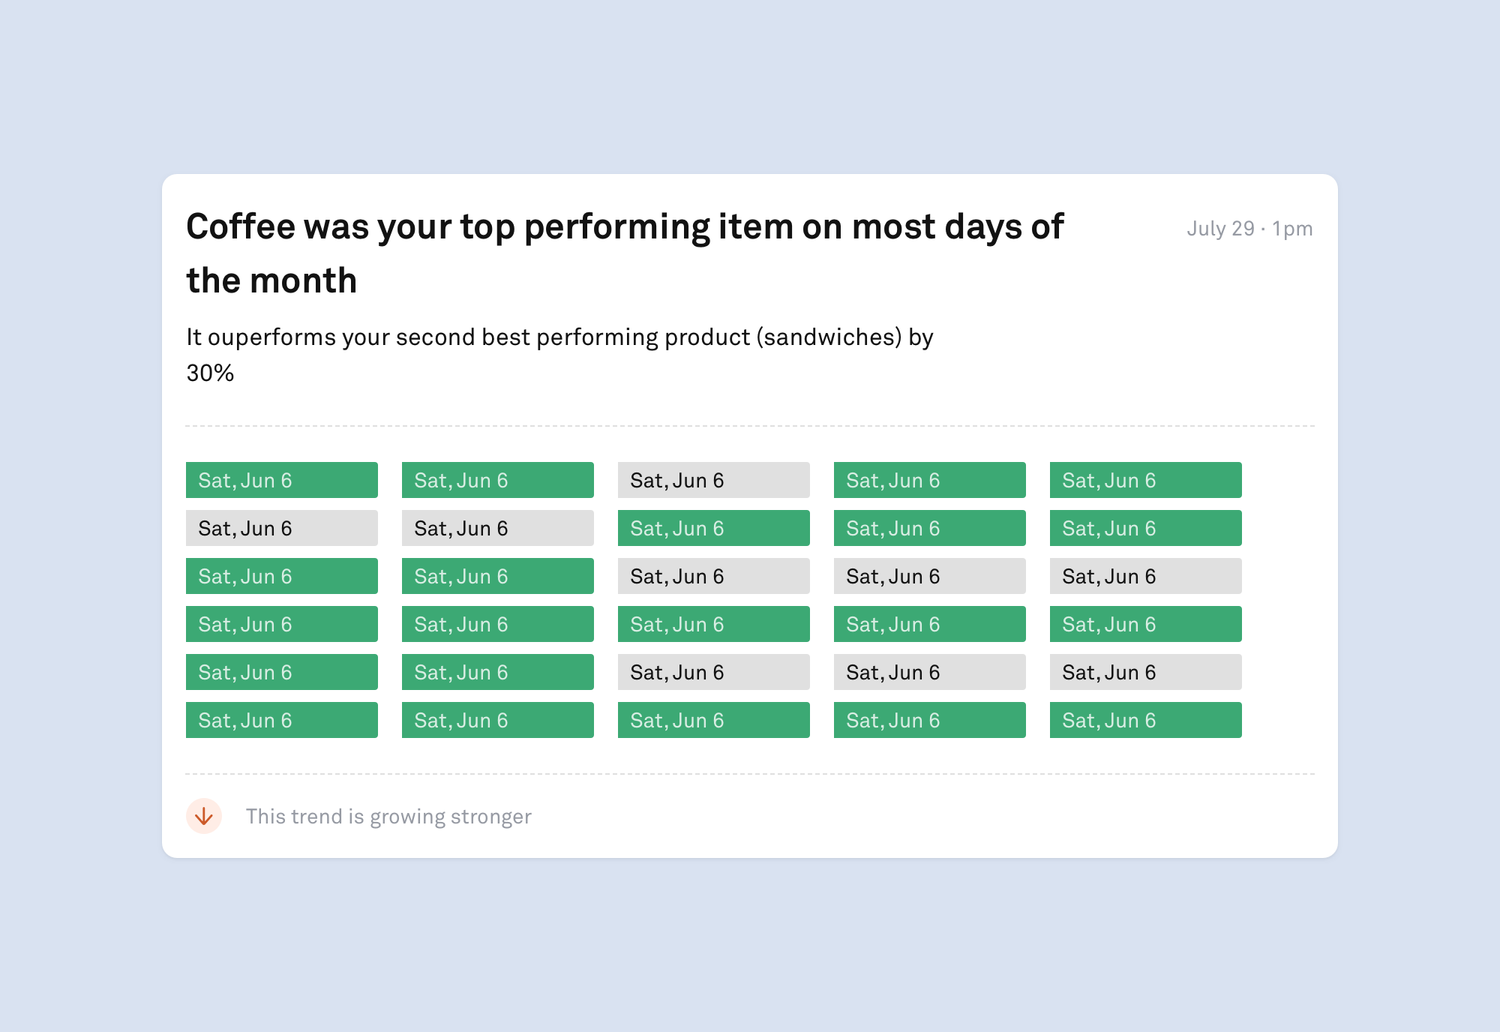
Monitor trends for specific products.
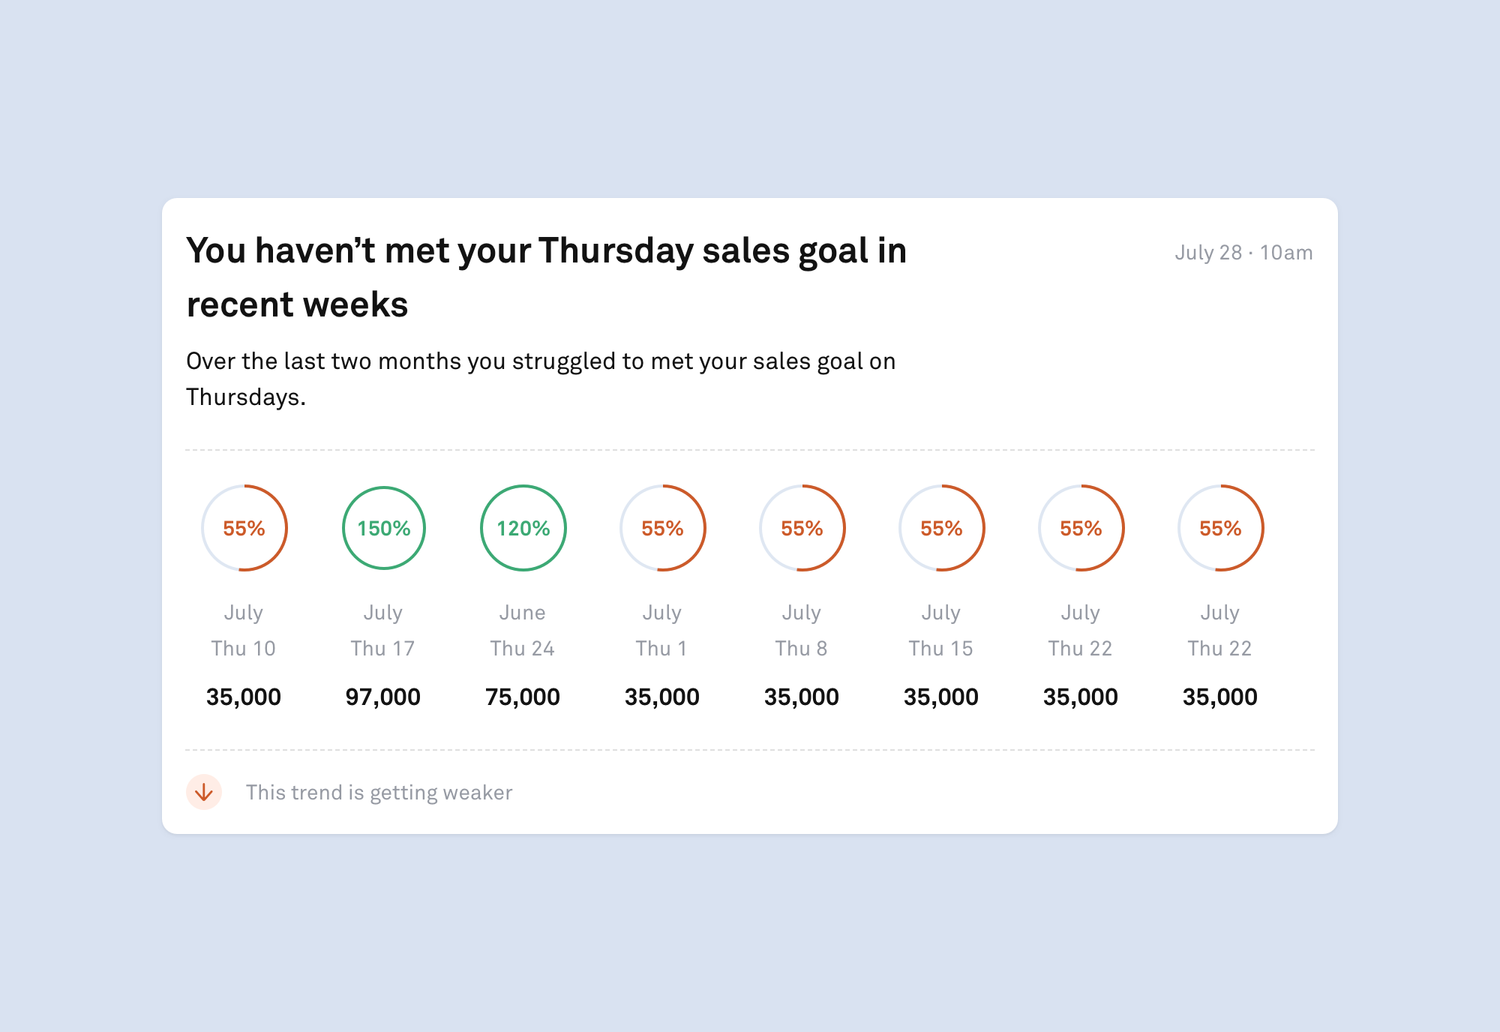
Set an overall sales goal to improve your average.
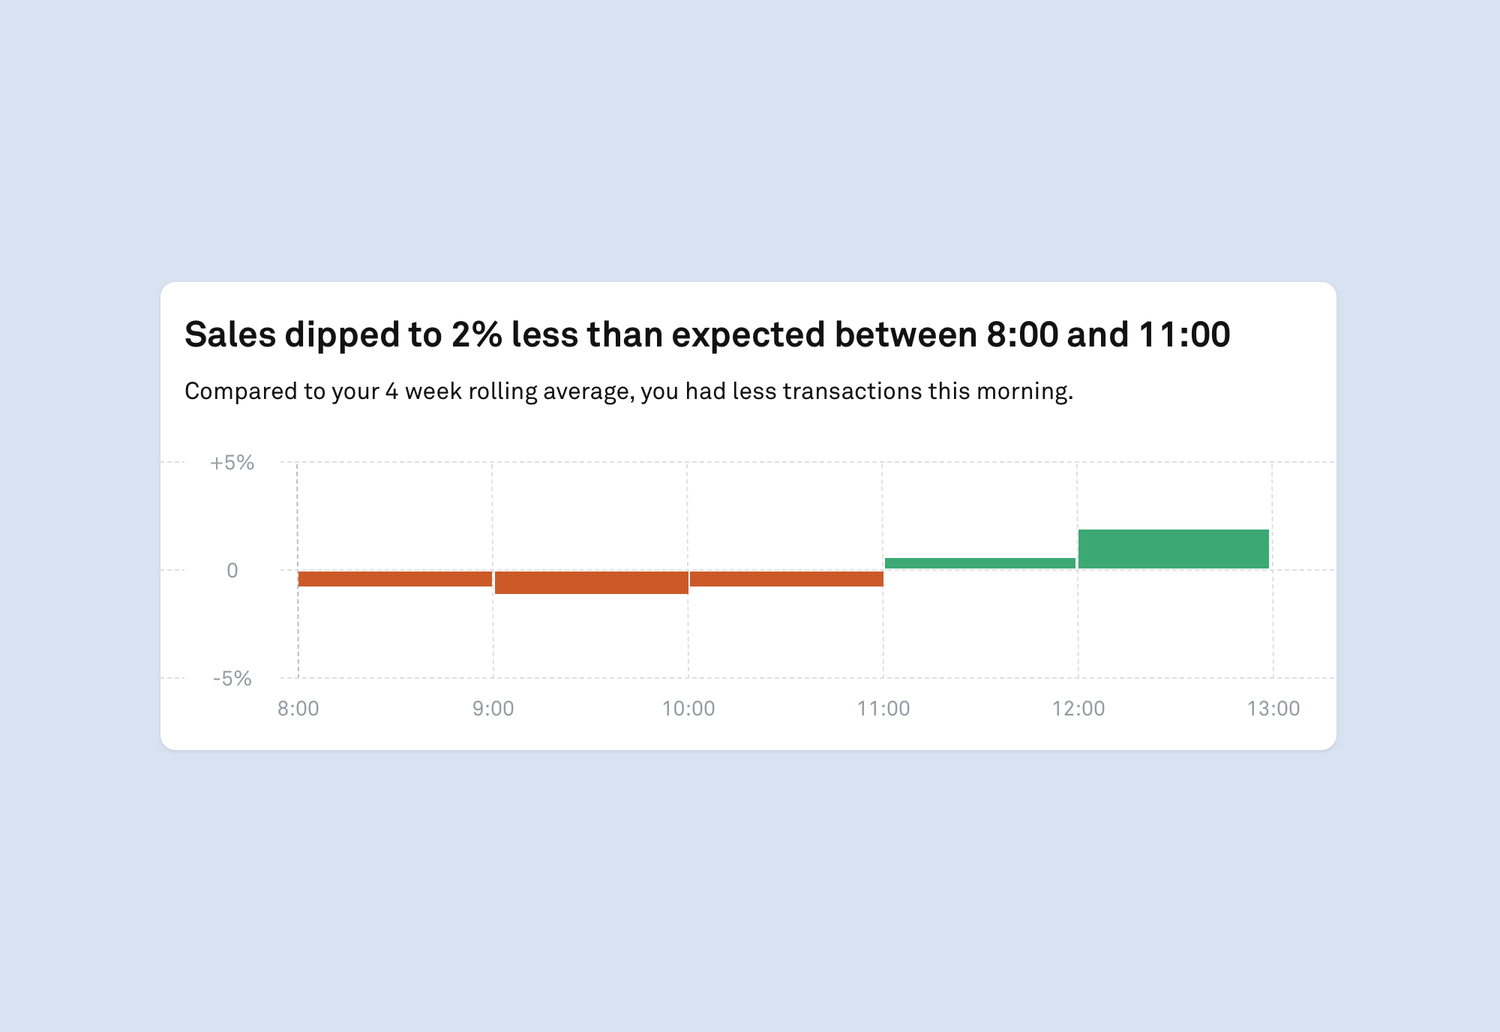
Get alerted when sales dip below a specific amount.
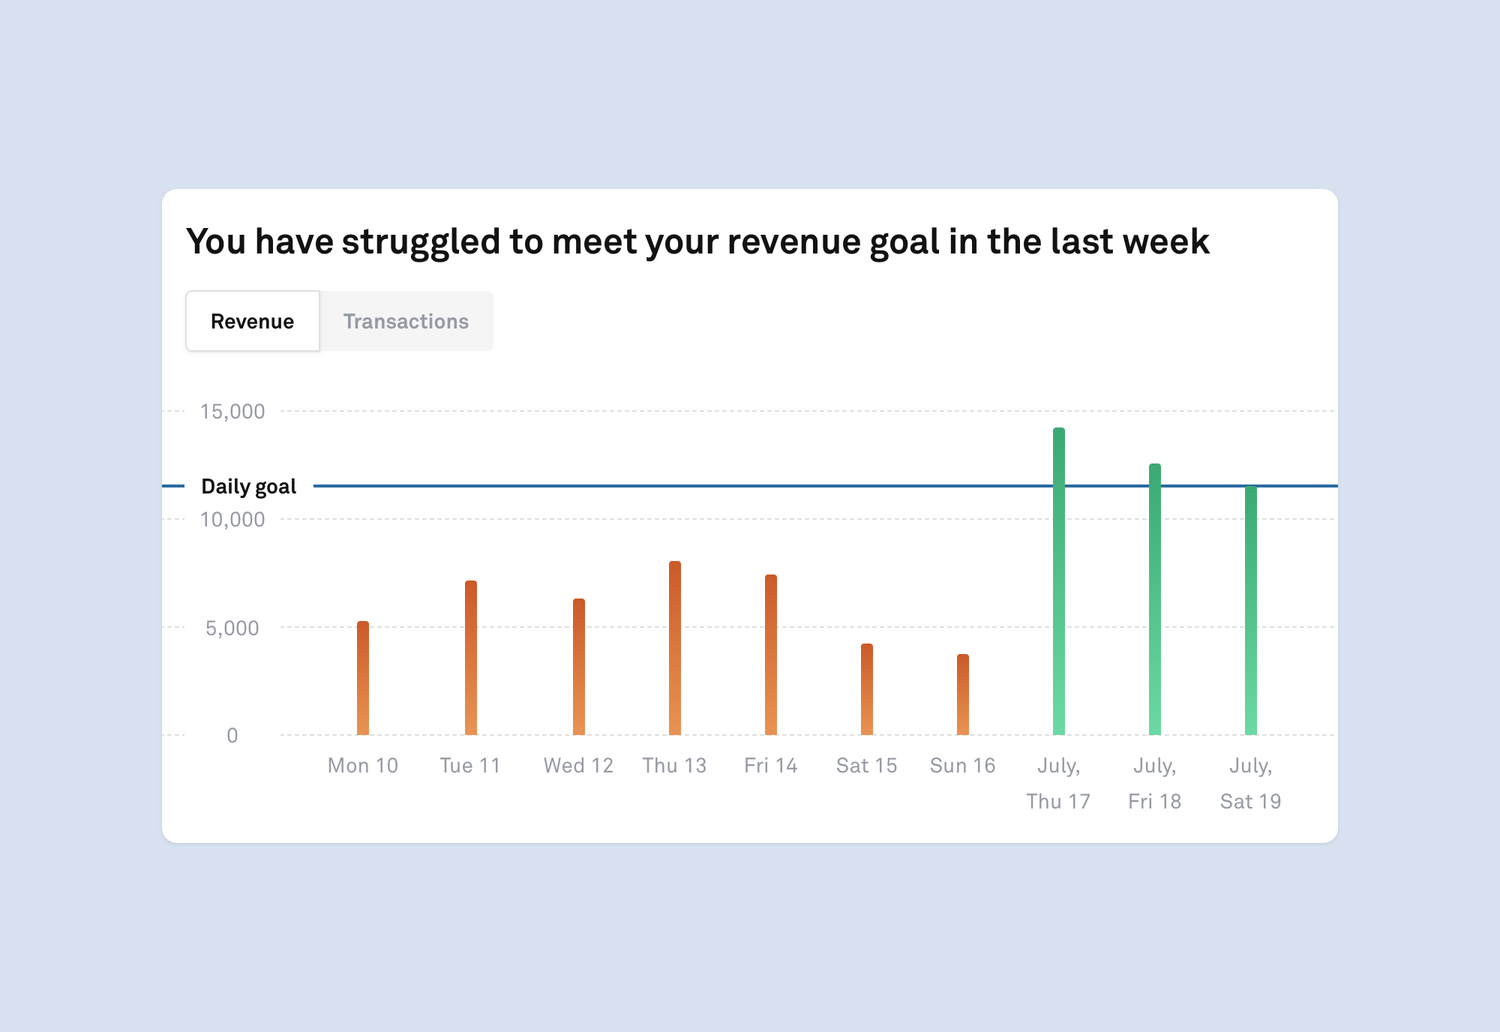
Set a revenue goal and see how often you're meeting it.
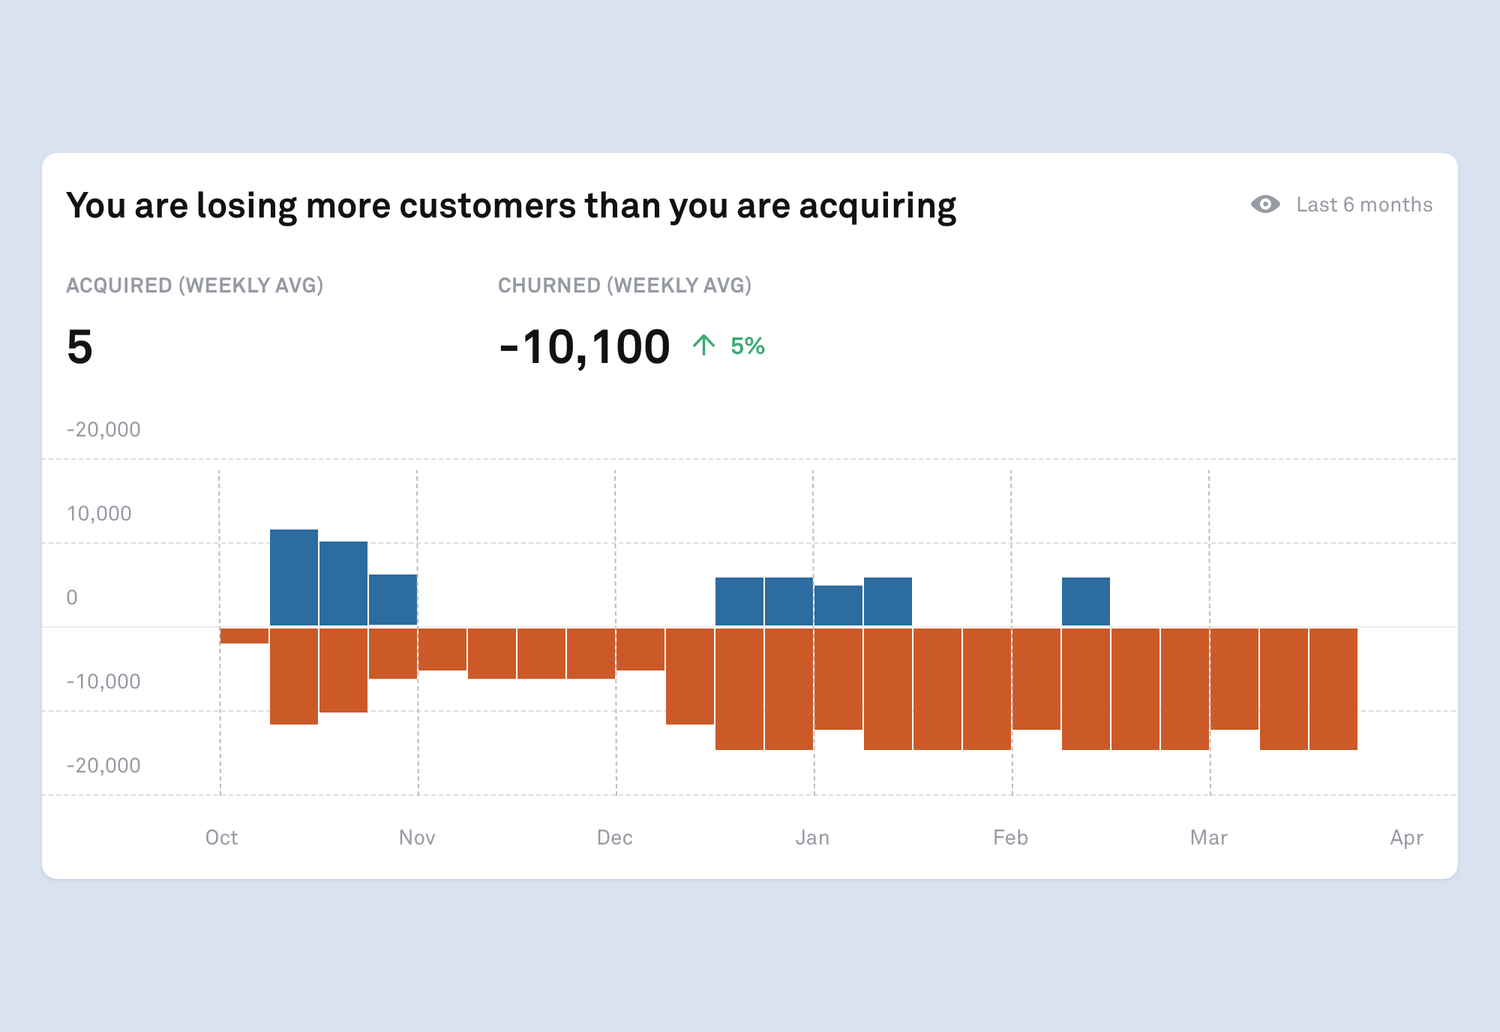
Compare new customers with churned and get alerted if you're loosing more than you are acquiring.
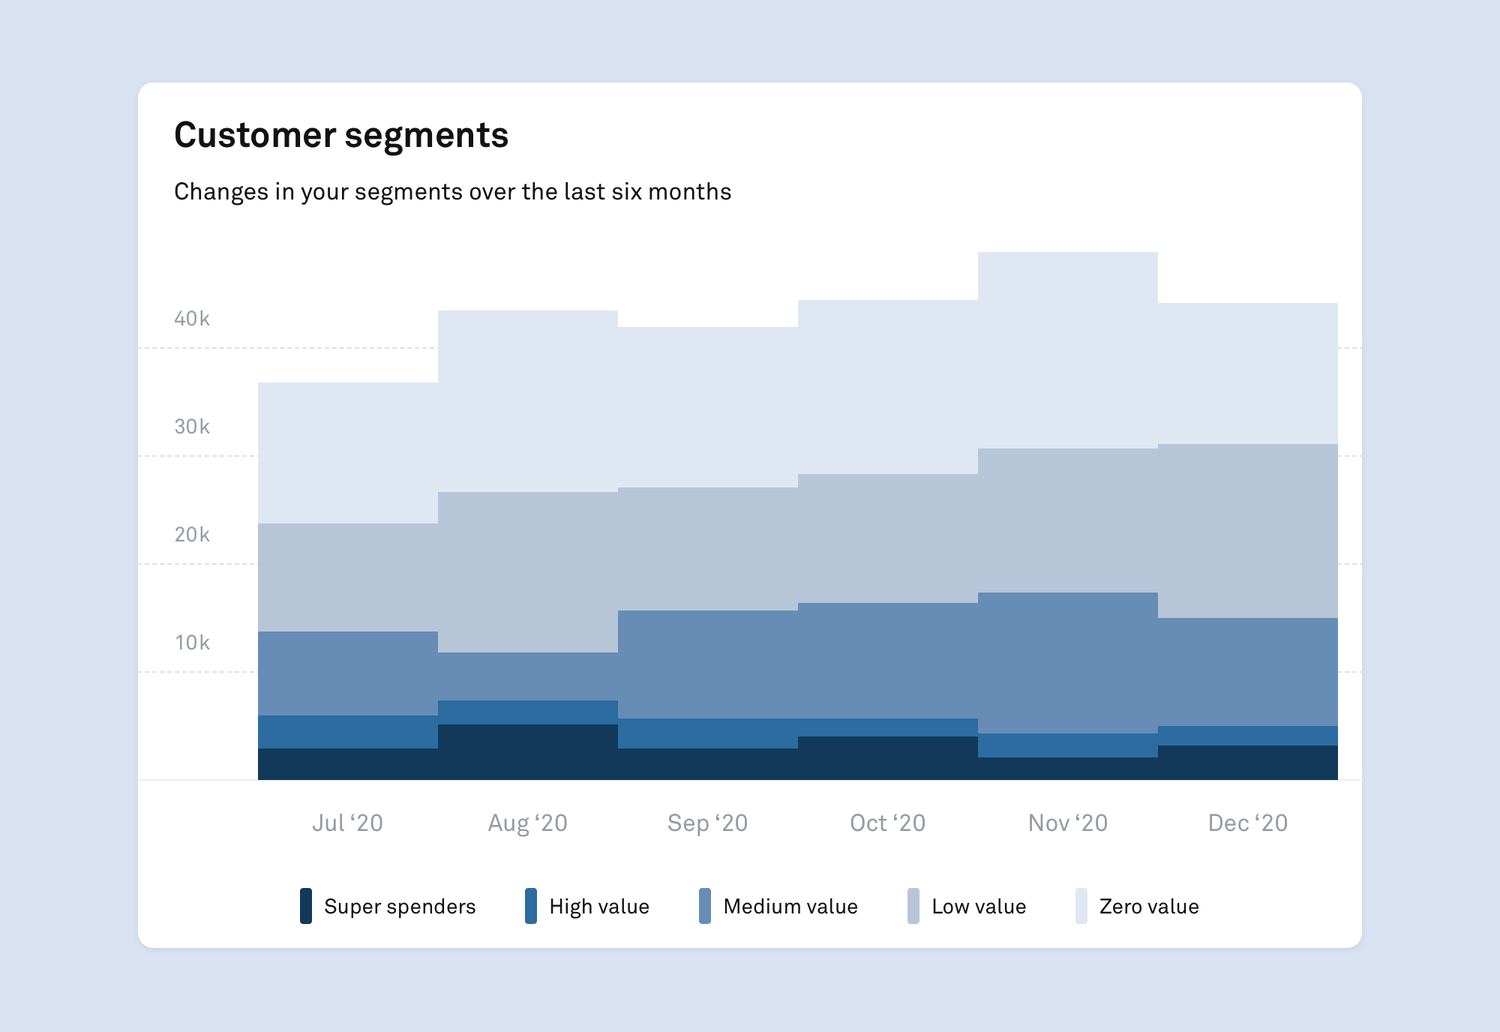
See the spending distribution of all customers.
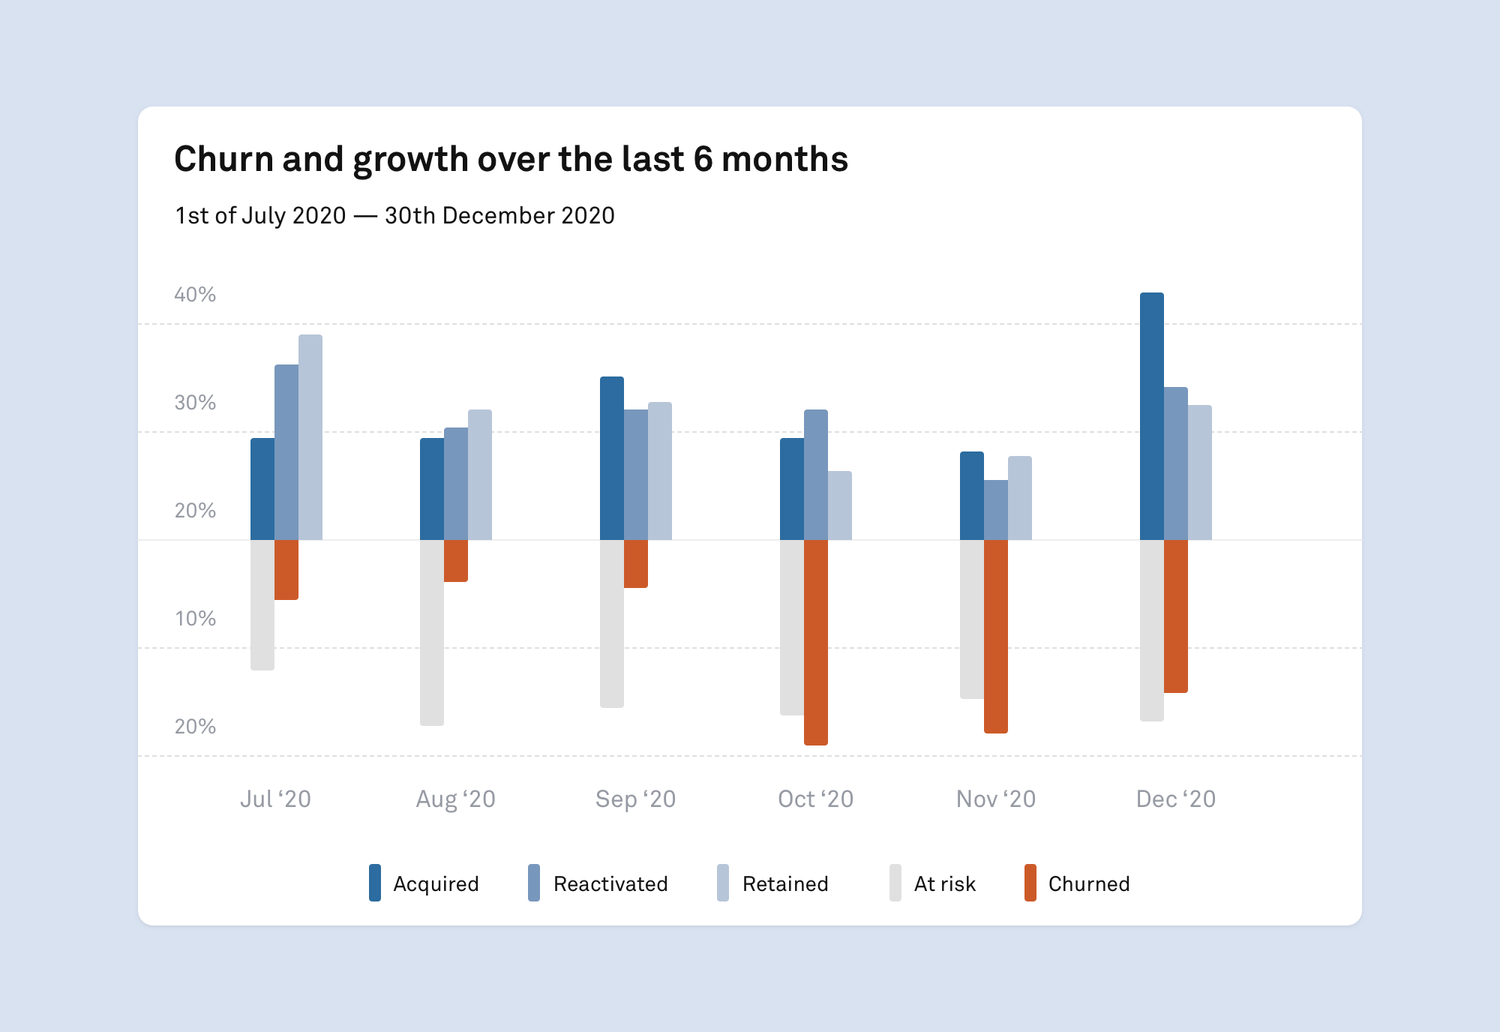
See churn and growth over time.
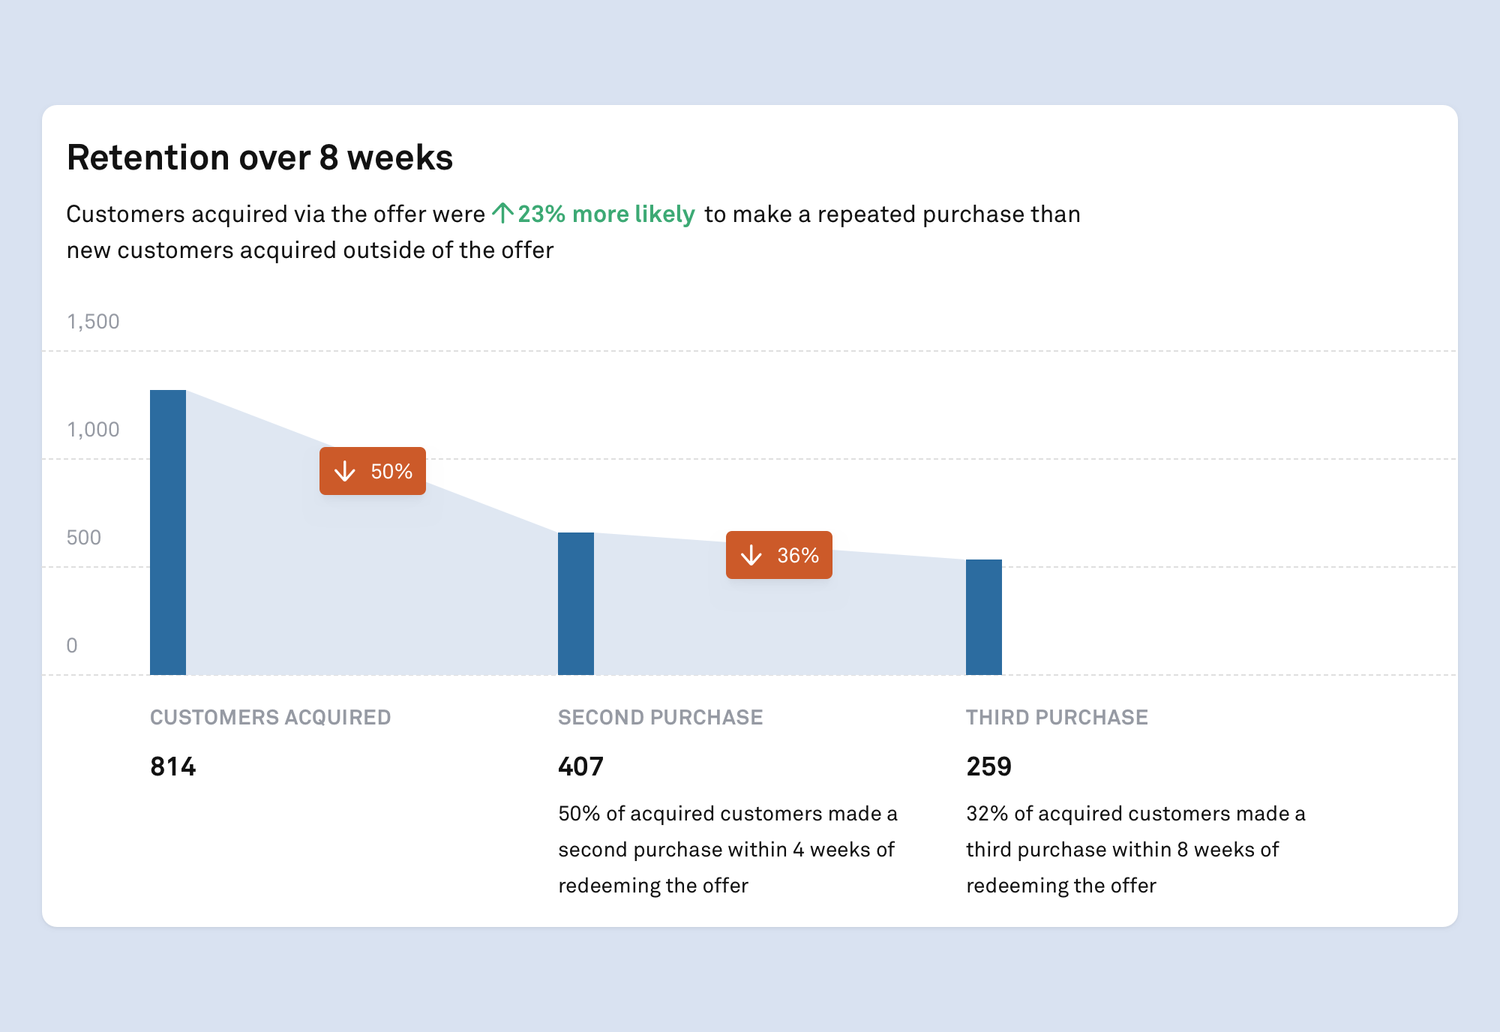
Track the retention of customers acquired via an offer.
What worked, what didn't
For a while, Blueberry was Flux's B2B core product; it helped us closing new sales and onboarding new retailers to the network.
However, two years in, we ended up sunsetting the product. The company changed strategy and went from focusing on SMEs to big nationwide retailers, the likes of H&M. Large chains had different needs and set of problems — although they were still interested in the insights on customers that we could surface for them, they didn't want yet another interface to explore the data. We shifted to provide insights via weekly reports, and directly feed them into the tools they were already using.
The product went on living in a different shape, primarily supporting the onboarding of online SMEs onto our platform, and as the dashboard they'd use to monitor the performance of the offers they were running on our network.